
Input Your Data
Instructions: Enter your numeric values separated by commas, spaces, or new lines.
Example: 10, 20, 30, 40 or one value per line.
Results
| Index | Original Value | Cumulative Total | Cumulative Percentage |
|---|
Calculate cumulative totals and percentages for your data
| Index | Original Value | Cumulative Total | Cumulative Percentage |
|---|
A cumulative percentage calculator helps you determine the running total percentage at each data point in your dataset. This powerful tool converts cumulative frequency values into percentage form, making it easier to analyze trends and distributions in your data.
Cumulative percentages are essential in data analysis, finance, education, and business intelligence. They help you understand how much of your total data falls within specific ranges and track progress over time.
A cumulative percentage represents the running total of percentages up to a specific point in your dataset. Unlike regular percentages that show individual values, cumulative percentages show the accumulated percentage from the beginning of your data series.
For example, if you have test scores and want to know what percentage of students scored below 80, a cumulative percentage would give you this information instantly. The final cumulative percentage in any dataset always equals 100%, representing the complete dataset.
Common use cases include:
The cumulative percentage formula is straightforward:
Cumulative Percentage = (Cumulative Frequency ÷ Total Frequency) × 100
Where:
This Excel percentage formula ensures accurate calculations for any dataset size. The cumulative frequency increases with each data point, while the total frequency remains constant throughout the calculation.
Let’s work through a step-by-step example using student test scores:
Sample Data:
Step 1: Calculate cumulative frequency for each range
Step 2: Apply the cumulative percentage formula
This shows that 71.4% of students scored below 90, providing valuable insights for grade analysis.
Excel makes calculating cumulative percentages simple with built-in formulas. Here’s how to set up your data visualization in Excel:
Basic Excel Formula:
=SUM ($B$2:B2)/SUM ($B$2:$B$10)*100
Step-by-step Excel setup:
Excel-specific tips:
The Excel approach is perfect for recurring calculations and professional reports requiring data visualization.
An online cumulative percentage calculator streamlines your calculations without complex formulas. These tools offer real-time output and eliminate manual calculation errors.
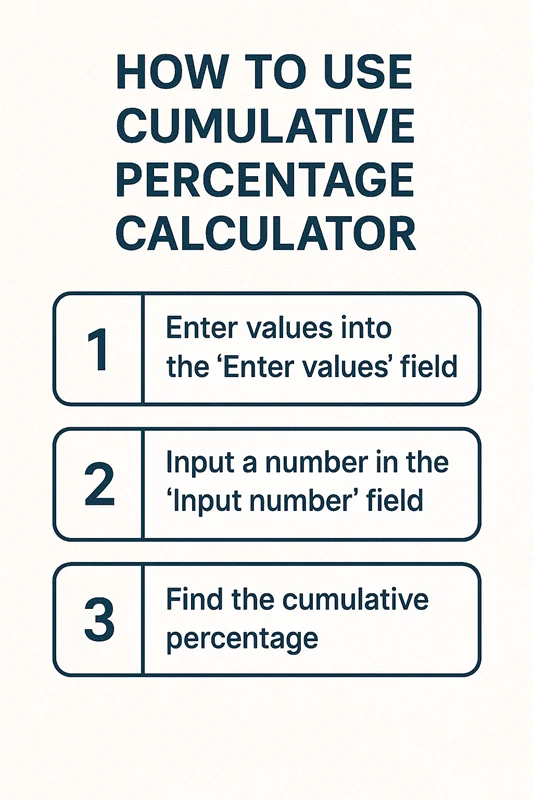
How to use the calculator:
Benefits of using the tool:
Online percentage calculators are ideal for quick analyses, student assignments, and situations where Excel isn’t available.
Business and Sales: Companies use cumulative percentages to track sales performance and identify top-performing products. For example, a retailer might discover that 80% of revenue comes from just 20% of their product lines, following the Pareto principle.
Education and Testing: Schools analyze test score distributions to understand student performance patterns. Teachers can identify if 90% of students scored above the passing threshold and adjust curriculum accordingly.
Market Research and Surveys: Survey analysts use cumulative percentages to understand response distributions. A customer satisfaction survey might show that 75% of respondents rated service as “good” or better, providing clear performance metrics.
Quality Control: Manufacturing industries track defect rates using cumulative percentages. Quality managers can quickly identify if 95% of products meet specifications and take corrective action when needed.
No, cumulative percentage cannot exceed 100% in a properly calculated dataset. The final cumulative percentage always equals exactly 100% since it represents the complete dataset. If your calculation exceeds 100%, check for errors in your frequency totals or formula application.
Cumulative sum shows the running total of actual values, while cumulative percentage shows the running total as a percentage of the complete dataset. Cumulative sum uses original units (dollars, students, items), whereas cumulative percentage always uses percentage format for easier comparison across different datasets.
Use the formula =SUM($B$2:B2)/SUM($B$2:$B$10)*100 where column B contains your frequency data. The dollar signs create absolute and mixed references, ensuring correct calculations when you copy the formula down. Format the result column as percentage for professional presentation.
Cumulative percentages help identify patterns, thresholds, and distributions in your data that individual percentages might miss. They're essential for understanding how much of your total falls within specific ranges and for making data-driven decisions based on cumulative trends rather than isolated data points.
Far far away, behind the word mountains, far from the countries Vokalia and Consonantia, there live the blind texts. Separated they live in Bookmarksgrove right at the coast
Far far away, behind the word mountains, far from the countries Vokalia and Consonantia, there live the blind texts. Separated they live in Bookmarksgrove right at the coast
Far far away, behind the word mountains, far from the countries Vokalia and Consonantia, there live the blind texts. Separated they live in Bookmarksgrove right at the coast
Enhance your data analysis with these complementary tools:
Excel Functions:
Online Calculators:
Data Visualization Tools:
The cumulative percentage calculator is an invaluable tool for anyone working with data analysis, whether you’re a student, business professional, or researcher. Understanding cumulative percentages helps you identify patterns, make informed decisions, and present data in meaningful ways.
Whether you choose manual calculations, Excel formulas, or online tools, mastering cumulative percentages will enhance your analytical capabilities. The step-by-step approach we’ve outlined ensures accurate results every time, while the real-world applications demonstrate the practical value of this essential statistical concept.
Start using cumulative percentage calculations in your next project to unlock deeper insights from your data and make more informed decisions based on comprehensive trend analysis.